Dashboards with today's numbers.
Helmsman builds management dashboards and business intelligence on live data from the systems that run your business. Sales, stock, production, cash and people are shown on one screen, so every department reads the same figure on the same day and nobody rebuilds the management report in Excel.
From $3,000Typically $3,000 to $80,000See pricing
Last updated
Who needs business dashboards?
You probably need it if…
- Someone rebuilds the management report in Excel every month.
- Two departments bring two different figures for the same thing to the same meeting.
- Management sees last month's position when it needs today's.
- The data you need sits in several systems that do not talk to each other.
- Every new question from management turns into a new spreadsheet.
What does business dashboards include?
- 01
Management dashboards
One screen, the numbers that matter
The figures each manager acts on, on one screen, drawn from the systems that run the business.
- 02
Live data
Today's numbers, not last month's
Dashboards that read from the live record, so a sale, a receipt or a dispatch shows up the same day instead of at month-end.
- 03
Drill-down
From the total to the transaction
Any figure can be opened to show what makes it up, by branch, product, customer or person, down to the individual document.
- 04
Data from several systems
Your systems, in one picture
Data from your ERP, accounting software, POS and spreadsheets brought together through system integration, so the dashboard shows the whole business.
- 05
Views by role
Each person sees their own
Owners, department heads and branch managers each see the figures that belong to them, with access set by role.
- 06
Alerts
Exceptions that come to you
Alerts when a figure crosses a line you set, such as stock below its minimum or receivables overdue, so problems surface before the monthly review.
- 07
Predictive analysis
What is likely to happen next
Forecasts of demand, stock or performance from the data your business already produces, where there is enough history to support them.
How does Helmsman deliver business dashboards?
The full approachA dashboard is only as good as the record behind it, so a BI project starts by agreeing what management actually decides with the numbers. Helmsman sits with the people who read the reports, lists the questions they ask every week, and traces each figure back to the system and the entry it comes from. Where the same number is entered twice, that is fixed first.
Dashboards are then designed around those questions and built in stages, with working screens you can check against figures you already trust. They are connected to the systems you run, rolled out to each role with training, and changed as the business starts asking new questions.
- 01UnderstandProcess map
- 02AnalyseRequirement document
- 03ArchitectSolution structure
- 04DesignScreens and flows
- 05DevelopWorking software
- 06ImplementLive system
- 07EvolveOngoing support
From quotation to dispatch, on one record
An industrial filter manufacturer in India: sales, production routes, stores, dispatch and accounts in one ERP, replacing an older system.
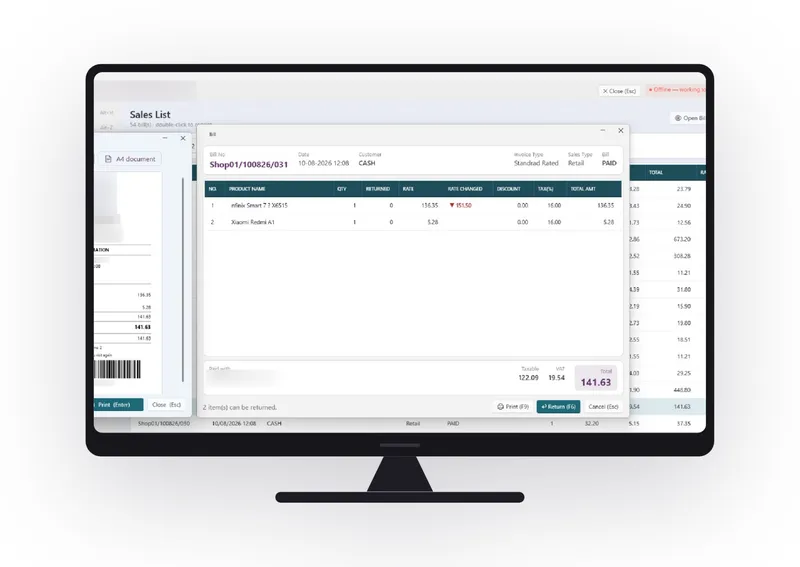
Retail billing, and the numbers behind it
A multi-store electronics retailer in the UAE, with a point of sale built to run the counter and answer head office.
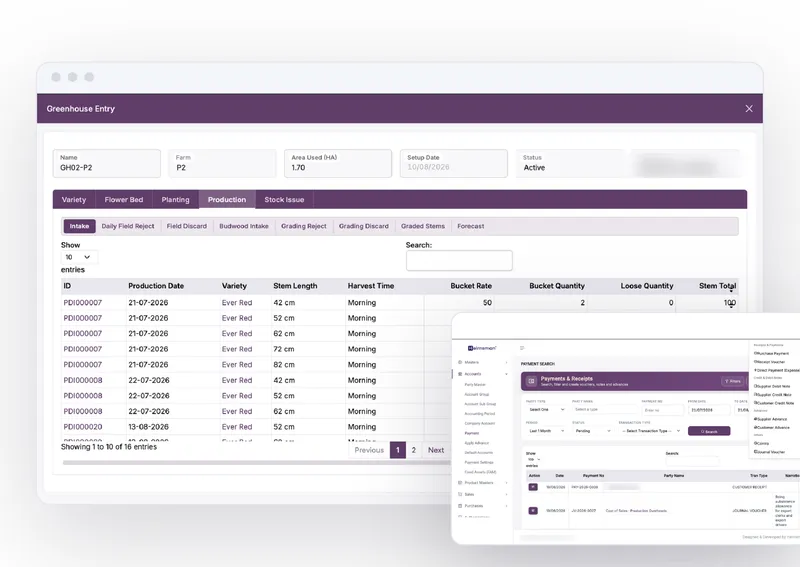
One ERP, from the greenhouse to the ledger
A flower farm in East Africa: production, grading, inventory, sales, accounts and HRMS in a single system.
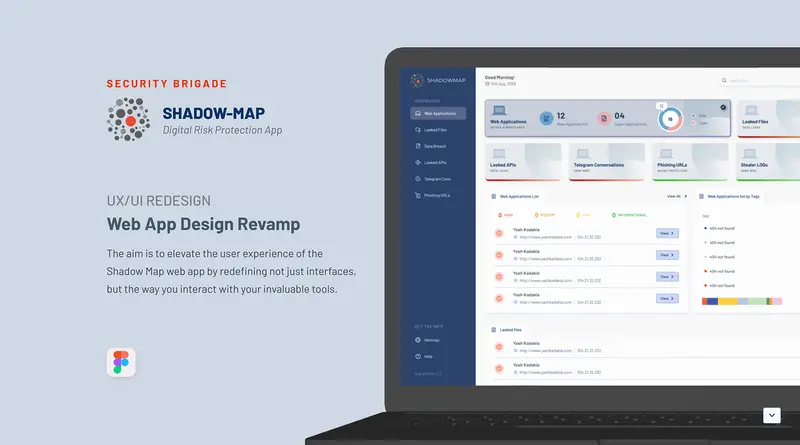
Shadow Map
A redesign of Security Brigade's digital-risk-protection dashboard and internal web app.
Industries we build this for
Dashboards questions, answered.
What is a business intelligence dashboard?
A business intelligence (BI) dashboard shows the figures management acts on, such as sales, stock, cash and production, on one screen drawn from live business data. It replaces the monthly report someone assembles by hand with numbers that are current every day.
Can a dashboard pull data from different systems?
Yes. Through system integration, data from your ERP, accounting software, POS and other tools is brought into one picture, so the dashboard shows the whole business rather than one department.
Do we need a new ERP before we can have dashboards?
Not necessarily. Dashboards can be built on the systems you already run. Where the underlying data is entered twice or kept in spreadsheets, fixing that first is what makes the dashboard worth trusting.
Why not use a ready-made BI tool?
A ready-made BI tool can work well when your data is already clean and in one place. Custom dashboards pay off when the figures come from several systems, depend on your own business rules, or need to sit inside the software your teams already use.
Can the dashboards forecast as well as report?
Yes, where there is enough history. Predictive analysis can forecast demand, stock or performance from the data your business already produces, alongside today's figures.